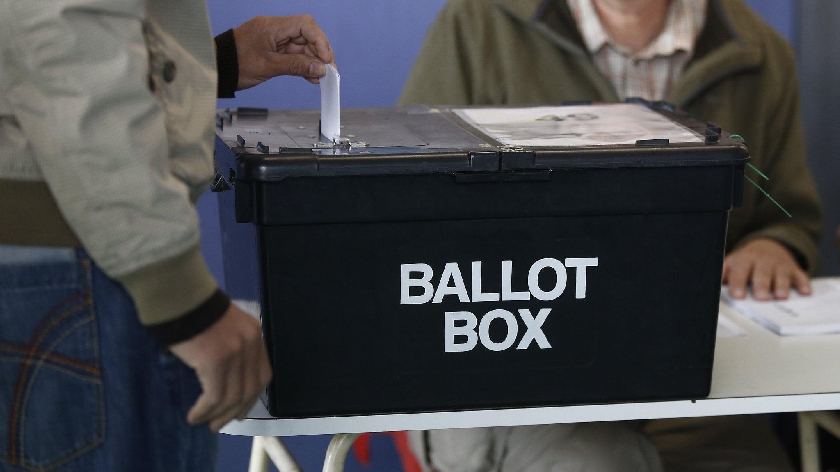
Voters across Milton Keynes are preparing to head to the polling stations tomorrow and vote for the councillors they would like to see make important decisions on their behalf.
This week, local elections are taking place in Milton Keynes. There are elections for all 19 Borough Wards with one vacancy in each ward.
Milton Keynes elects a third of its Councillors every year.
Last year, the Conservatives leapfrogged Labour to become the largest party with 24 seats, to Labour’s 19, and the Lib Dems on 13.
But, because the combined Labour and Lib Dems together held the majority vote, and together have the most seats in the council, the formed "Progressive Alliance" had since held office at Milton Keynes Council.
As people in Milton Keynes prepare to vote tomorrow, we have taken a look at last year's voter turn-out in the borough.
Last year, 72,536 voters turned out to sign their ballot papers out of 198,596 on the Electorate register. Overall, 36.52% of people on the Electorate register took part in the last local elections, around 26.9% of the overall Milton Keynes population.
616 papers were rejected. Ballot papers may be rejected if they have been improperly marked by the voter, this could be making more than once, if the voter is identifiable or the voter intention cannot be made certain.
The Milton Keynes area with the largest voting turnout was the Loughton and Shenley ward. Out of 10,082 people on the Electorate register, 4369 voted, the equivalent to 43.33%.
The smallest turn out was in the Woughton and Fishermead ward, with 24.98% of people on the Electorate voting, 2881 out of 11,531.
Not sure who to vote for? Milton Keynes local elections 2022: Here are the local party manifestos